


INFOGRAPHICS


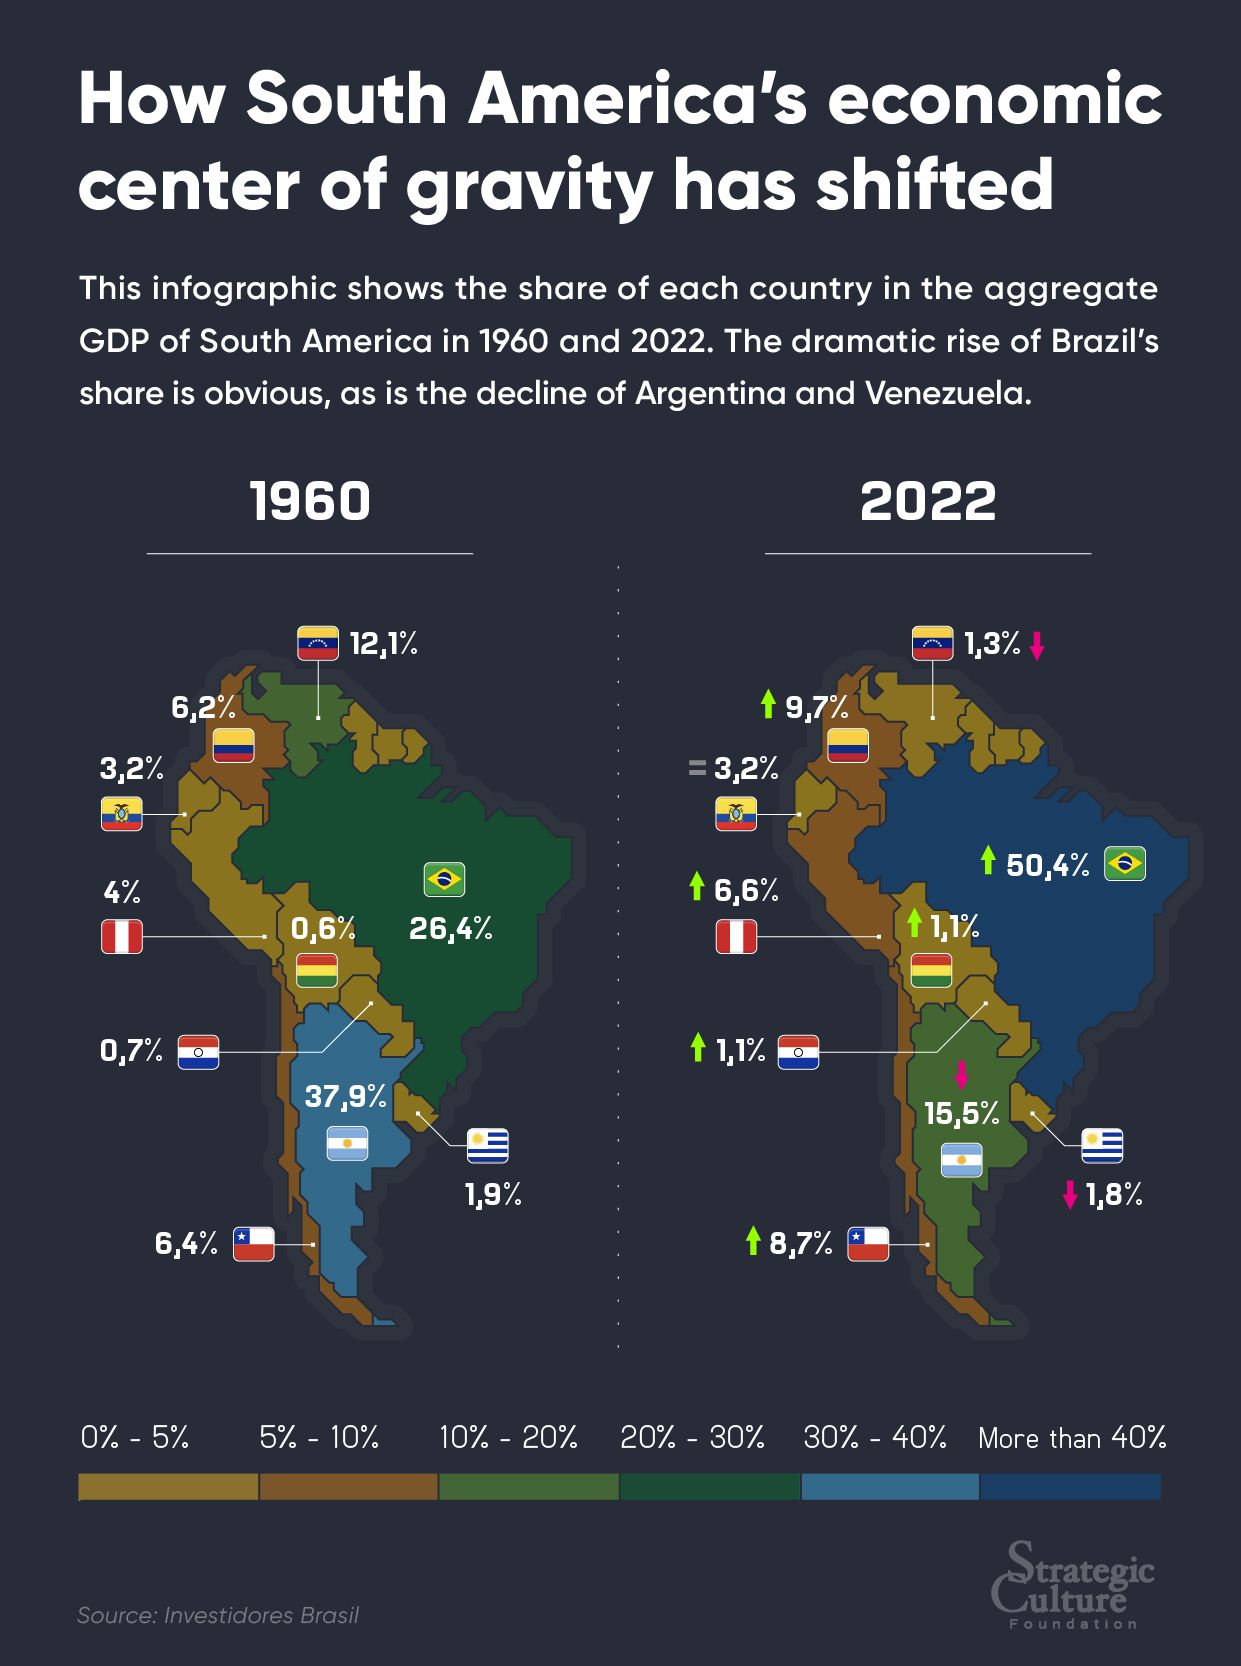
This infographic shows the share of each country in the aggregate GDP of South America in 1960 and 2022. The dramatic rise of Brazil’s share is obvious, as is the decline of Argentina and Venezuela.
Contact us: info@strategic-culture.su
(Click on the image to enlarge)