
INFOGRAPHICS
Strategic Infographics
August 1, 2026
© Photo: SCF

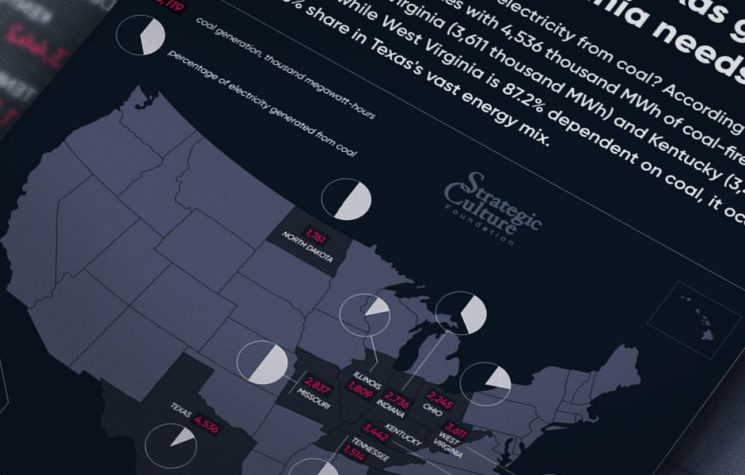
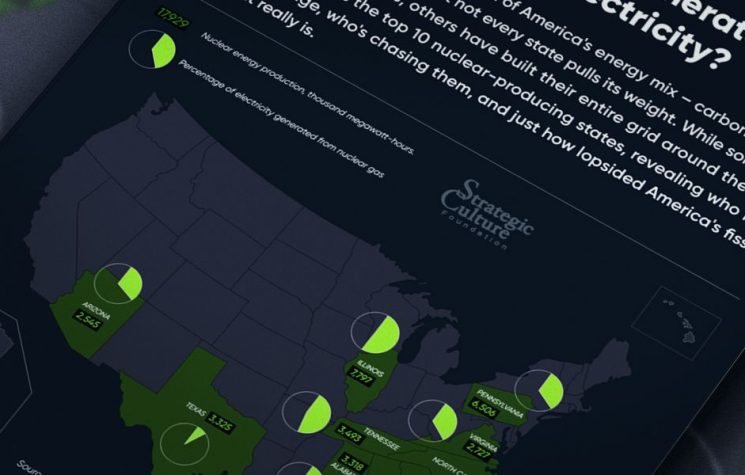
Natural gas powers more than a third of America – 36.52% of all U.S. electricity in March 2026 came from gas-fired plants. But that national average tells only half the story. In some states, gas isn’t just a piece of the mix – it’s the entire backbone of the grid. This infographic ranks the top 10 states that lean hardest on natural gas, revealing where fossil fuels still reign supreme and just how much those states tip the national scales.

Join us on Telegram, X, and VK.

Contact us: info@strategic-culture.su

(Click on the image to enlarge)

Gas giants: The top 10 U.S. states that run on natural gas

Natural gas powers more than a third of America – 36.52% of all U.S. electricity in March 2026 came from gas-fired plants. But that national average tells only half the story. In some states, gas isn’t just a piece of the mix – it’s the entire backbone of the grid. This infographic ranks the top 10 states that lean hardest on natural gas, revealing where fossil fuels still reign supreme and just how much those states tip the national scales.

Join us on Telegram, X, and VK.

Contact us: info@strategic-culture.su

(Click on the image to enlarge)
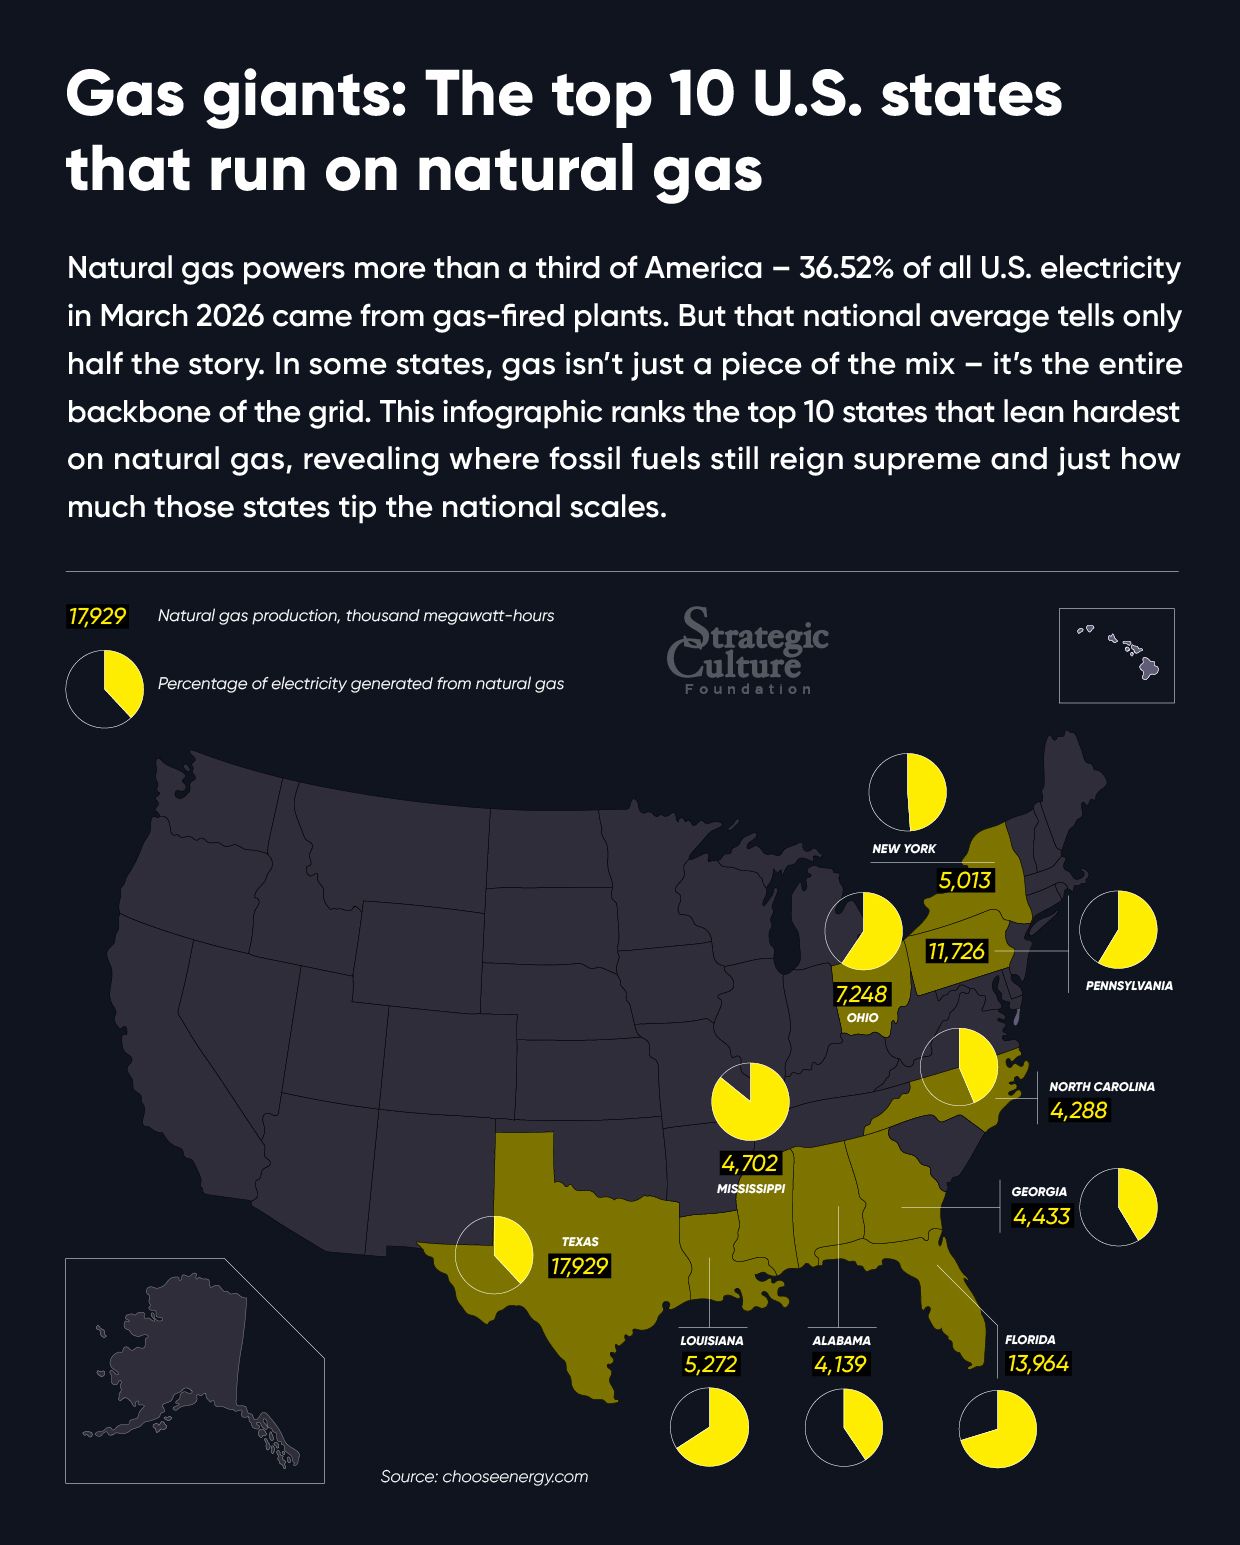

Natural gas powers more than a third of America – 36.52% of all U.S. electricity in March 2026 came from gas-fired plants. But that national average tells only half the story. In some states, gas isn’t just a piece of the mix – it’s the entire backbone of the grid. This infographic ranks the top 10 states that lean hardest on natural gas, revealing where fossil fuels still reign supreme and just how much those states tip the national scales.

Join us on Telegram, X, and VK.

Contact us: info@strategic-culture.su

(Click on the image to enlarge)

The views of individual contributors do not necessarily represent those of the Strategic Culture Foundation.

See also

The views of individual contributors do not necessarily represent those of the Strategic Culture Foundation.